
Data freshness refers to how up-to-date information in the output of a data product is. It typically refers to the duration of time between when a pipeline extracted some source data and now. But since data freshness is a concept, not a metric, the specific way it is quantified might be expressed differently depending on the context:
| Context | Convention | Examples |
|---|---|---|
| Referenced as a broader topic. | “Data Freshness” | “Set a Data Freshness policy” |
| Validate the freshness of a specific report | “Last updated: <timestamp>", “<duration> ago"
|
Example from Hex UI:  |
| Configure how fresh a batch pipeline should seek to keep data | “Every <interval>"
|
In Tableau UI:  |
| Track the time between when data originated and when it is served in results. | “<duration> out of date”
|
"4 seconds out of date" |
success
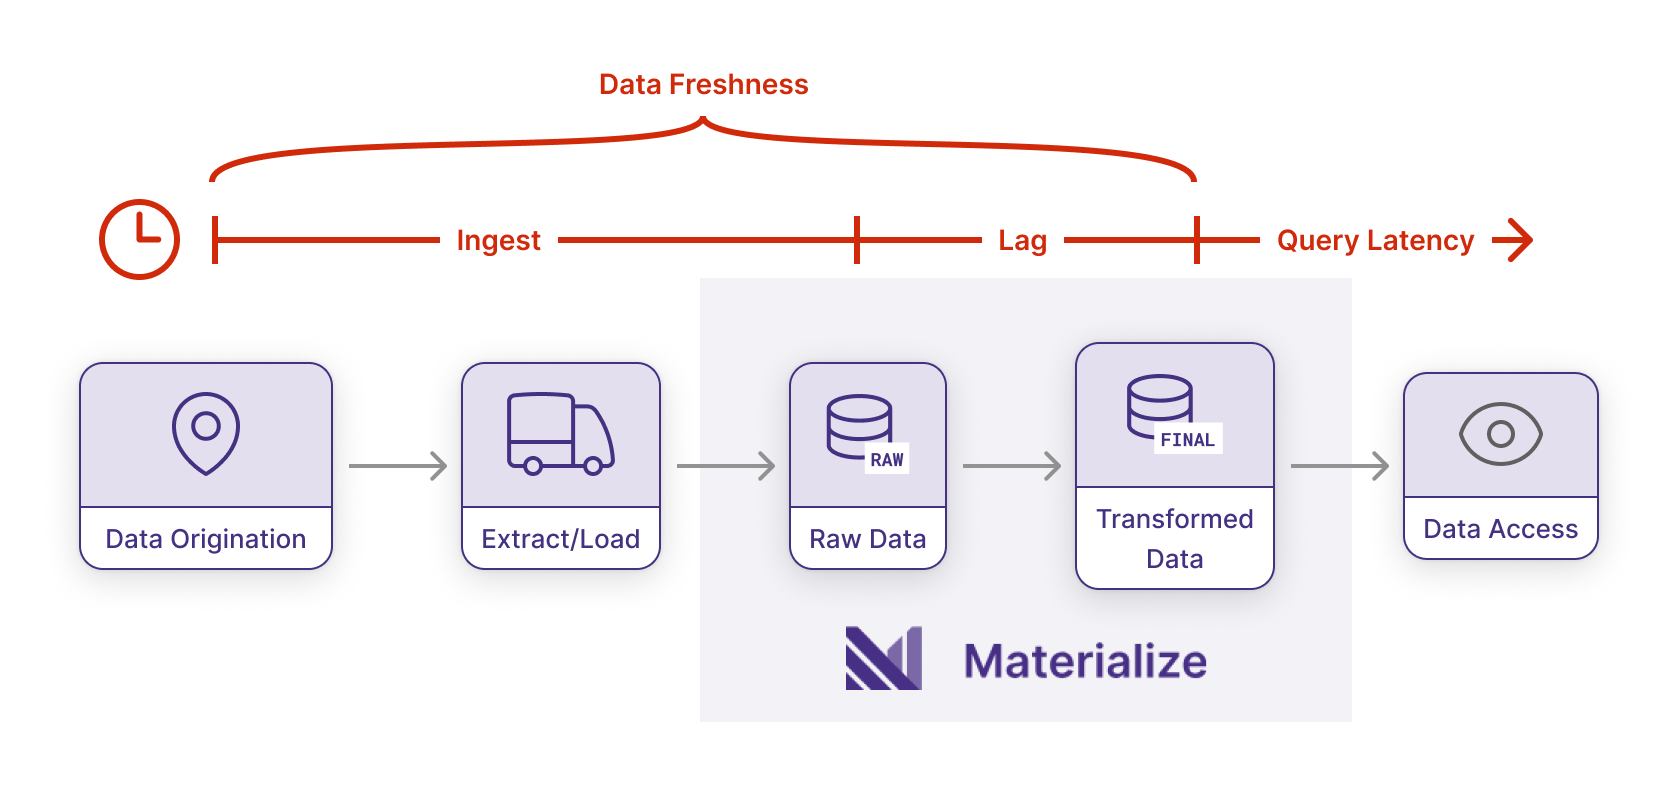
Data Freshness in Materialize:
In Materialize, freshness refers to the time between when data originates in upstream sources and when it is reflected in transformed results.
To use a real-world example:
- A change was written to an upstream OLTP application database at
t - It is read out via CDC to Kafka at
t +1sec, - It is consumed by Materialize at
t +2sec - The change is incorporated into transformed results at
t +2.5sec
We would describe data freshness as “2.5 seconds out of date”.
We use this all-encompassing definition because that is what is most important to the business in operational data workloads. Other more specific definitions only cover part of the pipeline, making them more useful for tracking pipeline health, but not illustrating the big picture.
When and why is freshness important?
Freshness in Analytical Work
In analytics, the value of tracking data freshness is mostly in providing confirmation that the current view is still actively updated.
Freshness in Operational Work
But for operational use-cases like business automation or user-facing features like dynamic pricing, we expect much tighter ranges of data freshness, and sometimes even need to codify different actions into downstream applications based on data freshness (e.g. don’t run dynamic pricing if data is more than 30 seconds out-of-date.)
Data Freshness Gotchas
1. Scheduled intervals make freshness variable
Because one side of the freshness interval is now, the current timestamp, if part of the pipeline is handled at a fixed interval (e.g. every 1 hour) the interval will cause the freshness metric to oscillate over time.
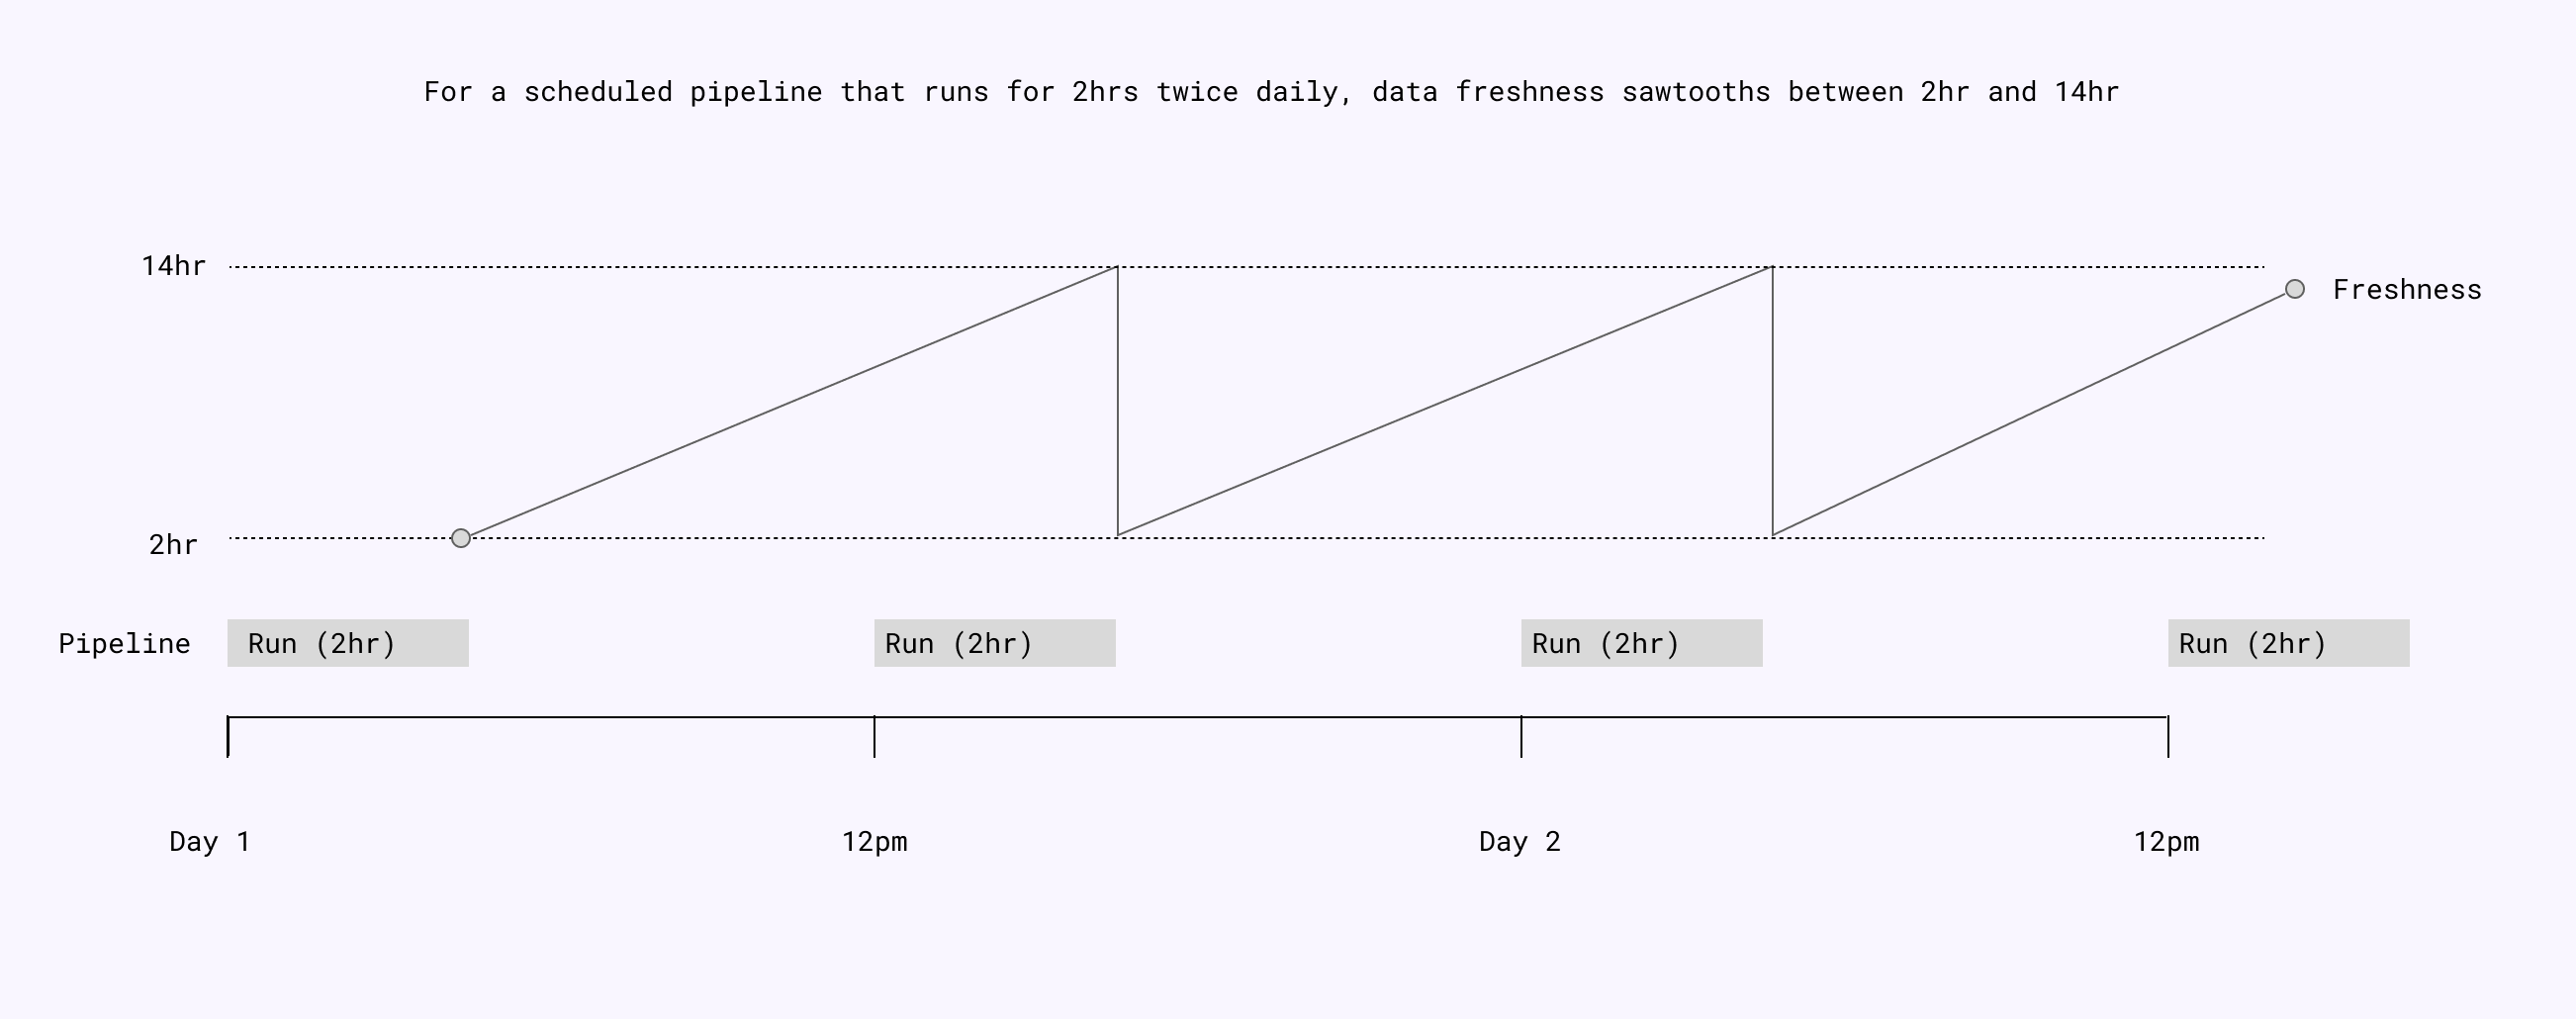
This typically isn’t an issue for analytics, but for operational purposes, it can create intolerable variability in experience.
For Example: If transactional-style emails are triggered using data that is updated at a scheduled 15-minute interval, some users will get immediate emails, others will experience a 15+ minute delay.
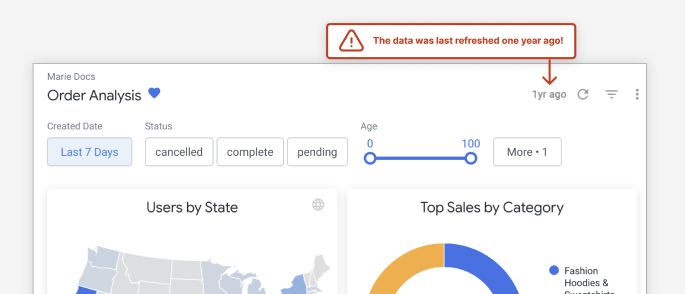
2. “Last Updated At” doesn’t give all the answers
Many batch data pipeline and BI tools will display a “Last Updated At” metric for data freshness, and let administrators set a “Refresh Interval” that tells the tool to automatically re-run the SQL when the cached results are too old. This is useful for some contexts (confirming that SQL has run) but misleading for others:
- It doesn’t confirm that the entire pipeline is properly running - Another part of the pipeline upstream of the BI tool could have failed, and BI is just re-running the SQL on stale data. There are a number of separate tools like Monte Carlo Data that address this limitation by separately tracking end-to-end data freshness.
- “Last Updated At …” does not mean “this is the state of your business as of …” - To give a contrived example to illustrate: If you extract/load/transform pipeline takes 24hrs to run, your view could say “Last updated 5 minutes ago” when the data is already 24hrs out of date.
3. Output can incorporate multiple sources with varying freshness
Much of the time, the results you are looking at are pulling together data from multiple sources. Depending on how you’ve architected those pipelines, the lag between when data originated and now might vary across the sources of data in your current view.
For Example
Imagine you have two sources of data:
- Activity on the product and website from behavioral analytics loaded into your data warehouse at 15 minute frequency.
- Canonical account data coming from an OLTP DB loaded at 1hr frequency.
For analytical contexts it is often good enough to know that the data is “up-to-date within an hour.” But if you’re joining the data and pushing it to operational tools that notify customers or take other actions, you risk pushing an incorrect state that never actually existed in your business, where the behavioral analytics say the user just deactivated a service, but the database says their spend rate is still high (because it is 45 minutes behind.)
Conclusion
The importance and the requirements of Data Freshness varies a great deal based on context. Even the specific definition can vary, so it’s important to be concise and up-front when working with teams that depend on your data to define Data Freshness, define the freshness requirements and budget, and select a tool that can meet those requirements. Materialize is an operational data warehouse that reduces problems caused by stale data by running the same kinds of SQL you might run on an analytical data warehouse, but computing results continuously, so that freshness (particularly the lag introduced by scheduled batch pipelines) is effectively zero.